LinkedIn Engagement Rate Benchmark by Industry: Your AI-Powered Guide to Crushing It

sushakanaujia
Author
Look, let’s be real. If you’re a Marketing Manager Maria (or one of the many Marias out there), you’ve probably heard the same old song: “LinkedIn is great for B2B! Just post!” But deep down, scrolling through your company page analytics, you’re squinting at those numbers, wondering, “Is this good? Am I actually moving the needle, or just churning out content into the void?”
Honestly, you’re not alone. Most B2B marketers are flying blind, comparing their LinkedIn numbers to… well, themselves. That’s a mistake. A big one. Because a 1% engagement rate might be stellar for a massive enterprise in a regulated industry, but it’s absolutely abysmal for a fast-paced SaaS startup. The real win isn’t just having an engagement rate; no, it’s knowing how your LinkedIn Engagement Rate Benchmark by Industry stacks up and, even more importantly, what to do about it.
This isn’t just another post stuffed with fluffy platitudes and generic tips. Nope. We’re digging into the trenches to give you specific data, practical strategies, and yes, even an AI-powered edge to not just meet, but absolutely crush your industry’s benchmarks. We’re talking about turning likes into leads, and views into pipeline. Ready to ditch the guesswork and start driving real business growth? Let’s get into it.
Understanding LinkedIn Engagement: What It Is (and What Your LinkedIn Engagement Rate ACTUALLY Means)
First things first, let’s clear the air. What does “engagement” even mean on LinkedIn? Because it’s way more than just a thumbs-up emoji.
Defining LinkedIn Engagement: Beyond Likes and Comments
Think of engagement as any interaction a user has with your content. Reactions, sure, they’re the lowest-hanging fruit. But honestly, they’re just the start. We’re talking comments (a massive signal!), shares (even better, from what I’ve seen!), clicks—whether they’re on an image, a video, or an external link—profile visits stemming from your post, and even how long someone hangs out reading what you wrote. The LinkedIn algorithm, bless its complex heart, definitely puts these deeper interactions first. It knows a comment or a share signals genuine interest. This means posts with comments or shares can boost your organic reach by up to 3x, compared to just likes alone, according to LinkedIn’s own algorithm priorities. So, while it’s nice to see those reactions tick up, don’t let ’em fool you into thinking that’s the whole story.
Step-by-Step: How to Calculate Your LinkedIn Engagement Rate Accurately
Alright, let’s get down to brass tacks. You can calculate engagement in a few ways, but some are definitely better than others, especially when you’re trying to compare apples to apples (or, in our case, tech SaaS to healthcare).
Here’s the thing: Most people go with “Engagements per Follower.” It’s fine for a quick snapshot of your overall page health, but it doesn’t really tell you how individual posts are performing. Why not? Because not all your followers will see every post. Impressions? That’s the real number that tells you how many eyeballs actually saw your content.
So, for comparing how individual posts perform and making smart, data-backed decisions about specific content, you really want the Engagements / Impressions method. It accounts for actual reach, not just your total following.
Here’s the formula you should be using:
(Total Engagements / Total Impressions) * 100%
Where:
- Total Engagements: Sum of reactions (likes, loves, insights, celebrates, curious, funny), comments, shares, and I’d recommend including clicks, as that genuinely shows someone’s interested.
- Total Impressions: The total number of times your content was displayed to LinkedIn members.
A quick example walkthrough:
Let’s say your latest LinkedIn post got:
- 200 Reactions
- 30 Comments
- 10 Shares
- 50 Clicks
- …and had 15,000 Impressions
Total Engagements: 200 + 30 + 10 + 50 = 290
Engagement Rate: (290 / 15,000) * 100% = 1.93%
See? Easy. Using ‘Engagements / Followers’ might give you a higher number, sure, but it’s often inflated and far less helpful for truly improving your content strategy. Stick with impressions for comparing content performance. That’s it.
Honestly, tracking this manually for every post can be a headache. You’ve got a business to run, right? That’s where tools like AICreatify come in handy. They pull this data for you, give you accurate calculations, and often even show trends over time.
Good LinkedIn Engagement Rate by Industry: Unpacking the Benchmarks for 2026
Alright, now you know how to calculate it. But what’s considered “good”? This is where the industry-specific benchmarks become your North Star.
General LinkedIn Engagement Rate Benchmarks Across All Industries
Before we dive into specifics, let’s set a baseline. For company pages, you’re generally looking at an average range of 0.5%-2%. But, and this is a big “but,” for individual posts, you really should be aiming higher – think 2-5%. “Excellent” performance? That can exceed 6-8%+ for content that truly hits the mark and connects deeply with your audience. (Source: Data from industry leaders like Rival IQ and Sprout Social consistently show these ranges.)
If your company page consistently clocks in below 1%, you’ve got work to do. If your posts are regularly hitting 3% or more? You’re doing something right!
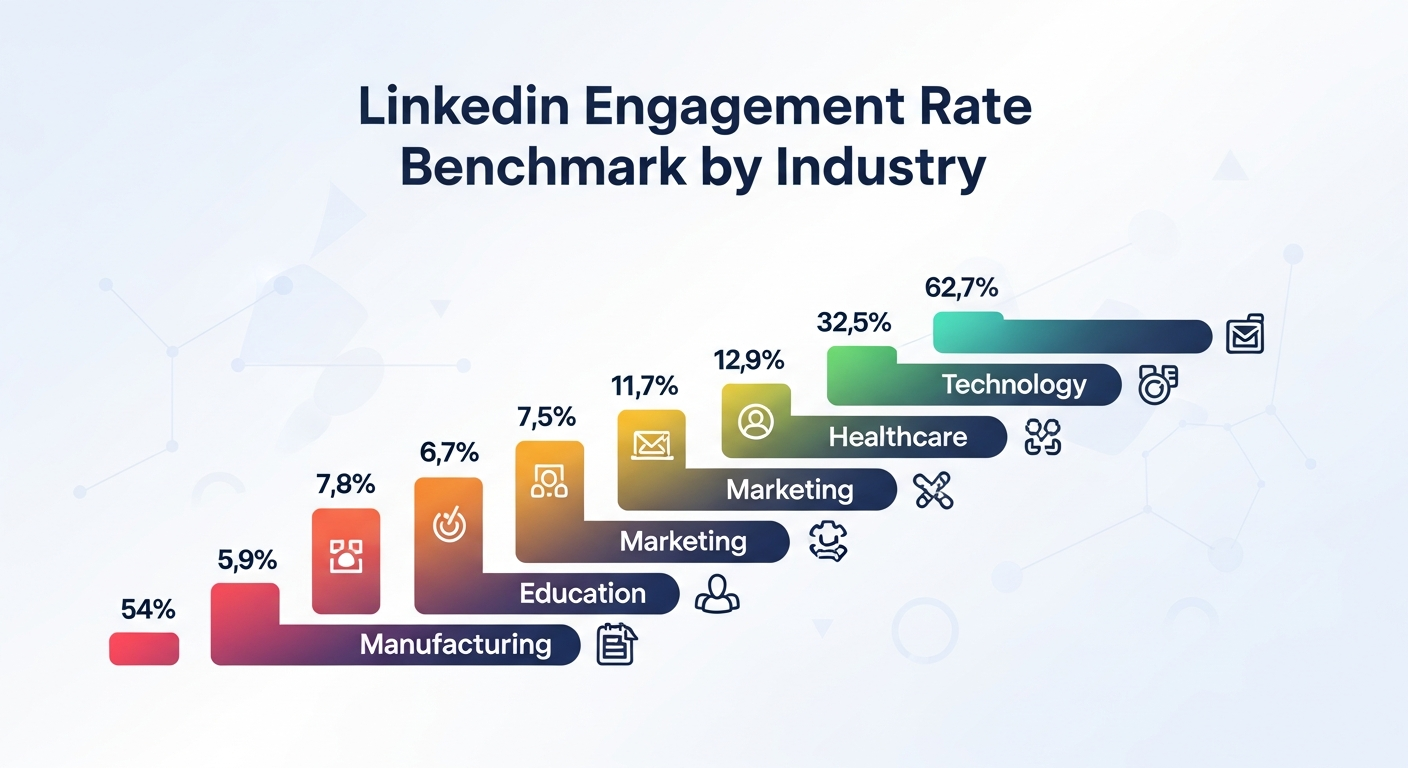
Detailed Industry Benchmarks: Where Your Business Stands
Now, let’s zoom in a bit. What’s considered “good” for a tech company definitely isn’t the same as for, say, a pharmaceutical giant. Each industry has its own rhythm, its own set of challenges, and its own audience behavior.
1. Technology & SaaS
- Average Post Engagement: 2.5% – 5%+
- Why it’s often higher: This industry really hums with new ideas, quick changes, and a smart, tech-savvy community always looking for what’s next. People in tech genuinely want to learn and connect about new tools, trends (hello, AI!), and solutions.
- Content that slays: Product demos that actually show the magic. Deep dives into future tech trends (think AI, automation, blockchain – you name it), clearly positions of thought leadership. Peeks behind the curtain at your employee culture. Case studies and real client success stories; those, in my experience, are your bread and butter. Short, punchy videos breaking down complex features often win big, too.
- Real-world Example: Drift. This B2B conversational marketing platform isn’t just selling software; they’re selling a vision. They consistently get high engagement by really tapping into expert insights and interactive content. Their “Revenue Vitals” report series, broken down into LinkedIn Live interviews, polls, and short video snippets, routinely sees 3-5% post engagement with a 0.8-1.2% click-through rate (CTR) to their full reports. That’s how you convert eyeballs into actionable leads. They just get that their audience wants insights, not just sales pitches.
2. Healthcare & Pharma
- Average Post Engagement: 0.8% – 1.8%
- Why it’s often lower: Regulations, compliance, and the sheer gravity of their work often mean a more careful way of doing things on social media. They can’t just throw out a controversial take without repercussions. Building trust is super important.
- Content that slays: Patient education, which, of course, needs to be general, not diagnostic! Updates on industry research. What’s new in medical tech, those innovations? Expert interviews (but make sure they’re carefully vetted for compliance) that zero in on sharing knowledge. Highlighting research findings or public health campaigns tends to work better than purely promotional stuff.
3. Financial Services
- Average Post Engagement: 1.0% – 2.5%
- Why it’s in this range: Again, trust and following the rules are huge. But unlike healthcare, there’s more room for market analysis and expert opinion. People are looking for reliable guidance.
- Content that slays: Market analysis reports, nice and clear. Explanations of new rules and regulations. Tips for managing wealth. Expert takes on economic changes, that sort of thing. Best practices for cybersecurity. Showing data trends visually? Oh yeah, that always helps cut through the jargon.
4. Manufacturing & Industrials
- Average Post Engagement: 1.2% – 2.8%
- Why it works here: Often overlooked, this sector thrives on showing new ideas, top-notch work, and the human side of big production. It’s very much a business-to-business world, so content needs to speak directly to specific industrial challenges.
- Content that slays: What’s going on with supply chains, good insights there. Efforts toward sustainability. Machinery actually working – short, satisfying videos are pure gold! Employee stories, showcasing their unique skills. Plus, client projects that clearly show how you solve big problems. Always ask yourself: what real-world difference do our products make?
5. Professional Services (Consulting, Legal, Marketing Agencies)
- Average Post Engagement: 2.0% – 4.5%+
- Why they typically perform well: These industries are literally built on knowledge and expert opinion. Smart ideas, the positions of thought leadership – that’s what people value here. Folks follow these brands (and their key leaders) for insights and answers.
- Content that slays: Whitepapers, sure. Really deep trend analyses. Client wins, especially case studies that spell out the how. Webinars with your experts. Oh, and building up the personal brands of your key leaders. Think of them as the go-to people for explaining tricky subjects.
- Real-world Example: Gartner. As a top research and advisory company, Gartner is all about expert insights. They don’t just dump lengthy reports on LinkedIn. Their growth strategy involves breaking down complex data into digestible carousels, short videos featuring analysts explaining key findings, and engaging questions to spark discussion. This approach, paired with really strong employee support, consistently yields 4%+ post engagement and drives significant traffic to their research, showing a highly engaged audience eager to consume expert content.
6. Education
- Average Post Engagement: 1.5% – 3.0%
- Why they hit these numbers: Education institutions often have passionate alumni networks and a strong focus on community building, career development, and lifelong learning.
- Content that slays: Stories of successful alumni. What’s new in education, the latest innovations. Handy career advice. Highlights from faculty research. And don’t forget chances for executive learning or professional growth.
7. Retail & E-commerce (B2B side)
- Average Post Engagement: 0.9% – 2.2%
- Why the range: This sector’s B2B side (think suppliers, logistics, technology providers for retailers) can be a bit more niche. Engagement, in my experience, really depends on how directly the content addresses the specific pain points of retailers.
- Content that slays: Spotlights on your suppliers. Industry news (especially trends that hit retail operations or shopper habits hard). Smart ways to handle inventory, some really good insights there. And of course, showing off tech solutions for common retail problems.
Beyond Averages: Micro-Benchmarks & Nuance (Company Size, Content Type, Audience)
Okay, those broad industry benchmarks are a good start, but let’s get even more granular, because context is everything.
- Company Size: Ever notice how smaller companies sometimes have higher engagement rates than massive enterprises? It’s not an accident. Companies with
<5,000 followersoften see higher engagement rates (e.g., 3-5%) than their enterprise counterparts (>100,000 followers, which often struggle to hit 0.5-1.5%). Why? Niche audiences. Smaller brands can feel more authentic, more direct, and they can build closer communities. For bigger brands, it’s just a sheer numbers game, and too-general messages often just don’t hit home with everyone. - Content Format: This is a big one. The type of content you post really changes how much engagement you get. Listen up: LinkedIn video posts typically generate 3x more engagement than text-only posts. Think about it—video stops the scroll, right? And interactive formats like carousels and polls? Those can achieve 2x-4x higher engagement rates than static images because they demand an action! (Source: LinkedIn’s own internal data frequently highlights this.) Long-form articles (LinkedIn Articles) are great for thought leadership and dwell time, but the accompanying feed post must be super engaging to get people to click through.
Knowing these nuances allows you to not just chase a number, but smartly pick your content types and fine-tune your messages to your specific company size and industry.
The ROI-Driven Framework: Connecting Your LinkedIn Engagement Rate to B2B Leads and Revenue
“Okay, Susha, great. So my engagement is 3.5%. What does that actually mean for my sales targets?”
This is the question that keeps Marketing Manager Marias up at night. And it’s a fair one. Because vanity metrics are, well, vanity. You need to connect those clicks and comments directly to the dollars in the bank.
The Direct Link: How High Engagement Fuels Your Sales Pipeline
Here’s the chain reaction:
- Brand Awareness: Engaging content gets seen by more people, leading to increased impressions and shares.
- Profile Visits: Curiosity, once piqued, often leads people to click on your company page or an employee’s profile.
- Content Consumption: They dive deeper into your articles, videos, or website.
- Lead Capture: Finally, those calls to action (CTAs) of yours have to be crystal clear, super relevant, and compelling—whether it’s downloading a whitepaper, signing up for a demo, or connecting with a sales rep.
LinkedIn isn’t just a branding tool. It’s a legit lead generation engine. In fact, companies with strong LinkedIn engagement see a 2-3x higher conversion rate from MQL (Marketing Qualified Lead) to SQL (Sales Qualified Lead) compared to channels with lower engagement. Why? Because prospects interacting with your content are essentially pre-qualifying themselves. They’re raising their hand, saying, “Hey, I’m interested in what you’re talking about.” That’s gold for your sales team.
Real-world Use Case: From Benchmark to Breakthrough (A B2B SaaS Success Story)
Let me tell you about NexusAI. They’re a mid-market B2B SaaS company that offers an AI-powered analytics platform for logistics. Super niche, super B2B.
Their problem? NexusAI’s LinkedIn company page engagement rate was stuck at 0.9%. Pathetic, right? Especially when the average for Tech/SaaS was closer to 2.5%. Their goal was ambitious: Boost MQLs from LinkedIn by 30% within four months.
Here’s how they turned it around, step-by-step:
Phase 1: Deep Dive & Strategy (Month 1)
- First, they faced the music: that 0.9%? A total bust. Competitors became their guides, specifically watching leaders in logistics tech. With AICreatify, they easily saw those successful brands were crushing it with short video explainers and fun, interactive polls about industry pain points (things like, “What’s really jamming up your supply chain these days?”). NexusAI’s own stuff, meanwhile? Mostly just blocks of text. No good.
- Then, they really pinned down their audience. No more guessing games. LinkedIn’s own insights, plus some deep dives with AICreatify’s data, showed them exactly who they were trying to reach: Logistics Managers, Supply Chain Directors, and VPs of Operations. These folks, it turns out, spent a lot of time on LinkedIn, digging into content about making things efficient, cutting costs, and predictive analytics.
- Next came the new content plan, helped big-time by AI. This step, honestly, was a massive shift. They basically fed AICreatify all their audience intel and what was hot in the industry (“AI for Last-Mile Delivery Optimization,” “Predictive Maintenance in Logistics,” that kind of thing). What did the AI do? It spat out a bunch of high-impact content ideas. Their new content calendar looked like this:
- Every week: A snappy (60-90 second) animated video, maybe explaining one specific analytics feature or tackling a common logistics issue. Visuals are key here.
- Every other week: Interactive polls. “What’s your biggest logistics challenge: Fuel Costs, Labor Shortages, or Data Silos?” Quick, easy ways to get people talking.
- Once a month: A longer, expert-level article published right on LinkedIn. These were often repurposed from their existing blog, but always started with a strong, visual summary on the main feed designed to stop the scroll.
Phase 2: Execution & Amplification (Months 2-3)
- They dove into creating and refining content: churning out video scripts, sharp poll questions, and article summaries that really pulled people in. AICreatify was a huge help, letting them A/B test different headlines and calls to action (“See How AI Boosts Efficiency” versus “Unlock Logistics Savings with AI,” for example). Tiny changes, sure, but they made a huge impact.
- Then came the employee advocacy push. NexusAI got 50 of its key people – across sales, product, and leadership – on board. They provided pre-written sharing options (AICreatify even helped draft some quick, effective lines for them) and set up a super simple way to track everything. This wasn’t about forcing shares; it was about genuine connection through their team.
- Distribution wasn’t left to chance. No “post and hope” strategy here. They shared content in 3-5 carefully chosen, highly relevant, moderated LinkedIn Groups. And guess what? They even tried LinkedIn Live, doing monthly “Logistics Tech Talk” Q&A sessions. It worked.
Phase 3: Tracking, Optimization & ROI (Month 4)
- Keeping a close eye on everything: Every day they checked engagement metrics (reactions, comments, shares, clicks), plus unique profile visits and website traffic coming straight from LinkedIn.
- Lead attribution became a priority. Seriously critical for understanding impact. They set up UTM parameters for every LinkedIn link, pushing that data directly into their CRM. This meant they could pinpoint precisely which pieces of content were bringing in those MQLs.
- Then they refined things. Those animated explainers? Consistently bringing in the top click-through rates (a 1.5% average) and tons of comments. Their move? They made more! Polls, too, were really strong for reaching people, so those stayed in the mix.
The Results (in just 4 months):
- Engagement Rate: Soared from 0.9% to a stellar 4.2% (company page average).
- Impressions: Grew by a whopping 65%, thanks to that boosted engagement making the algorithm happy.
- Website CTR from LinkedIn: Improved from 0.4% to 1.1%. Major traffic driver.
- MQLs from LinkedIn: Increased by 48%, absolutely crushing their initial 30% goal.
- Cost Per Lead (CPL): Reduced by 18% compared to their paid channels. Talk about undeniable ROI!
That’s the kind of story that gets you a promotion, Maria. It’s not just about getting more likes; it’s about connecting the dots to real business impact. Done.
Setting Your Industry-Specific Engagement Goals for ROI
Don’t just aim for “more.” Be specific. Set SMART goals.
- Specific: Increase company page engagement from X% to Y%.
- Measurable: Track monthly using your LinkedIn analytics or a tool.
- Achievable: Set a realistic target based on your industry benchmark (aim to be above average, or at least hit average if you’re underperforming).
- Relevant: Linked directly to MQLs, website traffic, or talent acquisition.
- Time-bound: Achieve this by Q4, or within the next 6 months.
Practical Execution Step: Want to project potential ROI from increased engagement? Use a simple formula:
(Target Engagement Rate Increase) x (Average Impressions) x (Improved CTR to a lead magnet) x (Lead Conversion Rate from that magnet) = Estimated New Leads. Then, multiply that by your average deal size for a potential revenue impact. This makes the business case crystal clear to your CEO.
Mastering Your LinkedIn Engagement Rate Benchmark: AI-Powered Strategies to Crush It
Alright, enough with the why. Let’s talk how. How do you actually get those numbers up and stay competitive? With smart strategy and a little help from our AI friends.
Content Strategy for High Engagement (Industry-Specific Tips)
Your content needs to be custom-fit, not one-size-fits-all.
- Thought leadership for Professional Services: Dig in deep on new rules and regulations, client success stories (anonymized where needed, naturally), and what top leaders think. Don’t be afraid to take a stance! Practical Execution: Host “LinkedIn Audio Events” with your subject matter experts. This encourages live discussion and interaction around complex topics, building rapport and making you the go-to place for answers.
- Product innovation for Tech: Short, lively video demos, “behind-the-scenes” glimpses of R&D, and polls asking about future feature preferences. Give them a sneak peek. Practical Execution: Use carousels to show how things work, step-by-step. Break down complex features into easy-to-grasp visual stories—it’s like a mini-demo that stops the scroll.
- Employee spotlight for Manufacturing: Highlight unique skills, safety best practices, and the cool, inventive projects your employees are tackling. Make the brand feel human. Practical Execution: Create a “Day in the Life” video series featuring different roles within the company. It’s great for brand and also an excellent way to find new talent.
- Data-driven insights for Financial Services: Show off market trends using really clear charts, expert takes on economic shifts, and interactive Q&As on investment strategies. Practical Execution: Take your chunky quarterly reports and turn them into visual “data snacks” for quick consumption on the feed, but always link to the full report for genuinely interested users.
The common thread here? Personalization, storytelling, and an unwavering commitment to value-first content. Don’t just post to post. Post to solve a problem, educate, or inspire.
Working with the LinkedIn Algorithm for Organic Reach
The algorithm is a beast, but you can feed it what it craves. It prioritizes dwell time, shares, and comments. Period. Listen, posts with 5+ comments or 2+ shares within the first hour often see their organic reach amplified by 2-5x compared to posts that just get a bunch of reactions. So, how do you hack it?
Practical Execution Steps:
- Grab them fast. Don’t ever waste that first sentence. Hit them with a burning question, a bold claim, or a story they can relate to. Instantly, you’ve got their attention.
- Beg for comments (in a nice way). Make it a point to ask questions right in your posts. And don’t just post and walk away—reply to every single comment you get. Seriously. This isn’t just good manners; it makes people spend more time on your post, telling the algorithm your content is stirring up real talk.
- Tag smart. Bring in relevant people or other companies – but be super careful. Don’t spam. Only tag if it actually adds something to the discussion or loops someone in who needs to see it.
- Figure out the best time. Sure, everyone says Tuesdays-Thursdays, 9 AM to noon. But your audience? They’re different. Honestly, dig into your own LinkedIn analytics and see when they’re most active. That’s the real sweet spot.
- “Native” content rules the roost. Always put LinkedIn’s own video or document formats (PDFs, PowerPoints) first, rather than external links, in your main post. If you absolutely have to share an outside link (like to your latest blog post), pop it in the first comment, then tell people to check it there. The algorithm just prefers to keep folks hanging out on its platform.
Employee Advocacy: Your Secret Weapon for Getting the Word Out
Look, your employees are your biggest asset, and they’re often LinkedIn power users anyway. Content shared by employees generates 8x more engagement and has 2x higher CTR than content shared by your company page. Think about it. People trust people, not logos.
Practical Execution Steps:
- Give it a real name. Seriously, you need a proper, clear employee advocacy program. Think guidelines, rules of thumb, all that good stuff.
- Make content access brain-dead simple. Set up an internal spot – a Slack channel, an intranet page, maybe even a specific advocacy platform like GaggleAMP – where your team can instantly grab pre-approved content (text, images, video… everything). Also, give them ready-to-use messages. Never make them wonder what to type.
- Train ’em up, maybe reward ’em. A quick session on LinkedIn best practices for sharing? Super helpful. And perhaps, just perhaps, throw in some recognition or a small perk for those who really stick with it. Monthly shout-outs? A gift card here and there? A little incentive often goes a seriously long way.
- Real-world Example: Salesforce. Salesforce is a masterclass in employee advocacy. They enable their enormous global workforce to share company news, thought leadership, and product updates. This strategy means their content reaches millions beyond their corporate page’s followers, driving immense organic reach, brand authority, and a significant portion of their B2B leads from social channels. Their internal tools really smooth out the process, leading to incredibly high adoption rates. You can bet they’re not asking their employees to manually copy-paste.
Advanced Tactics: LinkedIn Groups, Live, and Newsletter Integration
Don’t just stick to the feed. LinkedIn offers more.
Practical Execution Steps:
- Get active in LinkedIn Groups. Seriously, stop just watching from the sidelines! Jump into 3-5 industry groups that are actually relevant and, importantly, moderated. Add your own thoughts, answer questions. And now and then – but only if it genuinely adds value – drop a link to one of your amazing blog posts as a handy resource in a relevant chat. Rule of thumb: no spamming, always bring value.
- Try LinkedIn Live. This thing’s a real treasure trove for getting people engaged right now. Why not host regular webinars, Q&A sessions, or even product demos using Live? Make sure you push it hard beforehand. During the broadcast? Talk to the people commenting – give ’em a shout-out! Afterwards, snip out the best parts into short video clips for your main feed.
- Start a LinkedIn Newsletter. Your company could totally launch one. Use it to pull together the big ideas from your blog posts, new reports, or industry analyses. This builds a subscriber list directly on LinkedIn, and here’s the cool part: your subscribers get an automatic ping whenever you publish. That’s a direct link straight to a really tuned-in audience, big-time boosting reach and interaction for your longer content.
Optimizing with AI: How AICreatify Boosts Your LinkedIn Game
You’re smart. You know AI isn’t coming for your job; it’s here to make you better at it. And for LinkedIn, it’s a game-changer.
How AICreatify can help you beat those industry benchmarks:
- Content Ideation & Creation: Forget writer’s block. AICreatify can pinpoint trending topics specific to your industry, based on what’s currently getting traction. Then, it can generate engaging copy and headlines for you, tailored to your brand voice and built to get lots of engagement. You want viral post templates? We’ve got ’em.
LinkedIn Hooks for Founders is a good example of this, providing those viral templates based on what works. It helps you craft posts that truly capture attention.
- Performance Analysis: Go beyond basic numbers. AICreatify tracks and makes sense of engagement metrics across your posts and competitors, pinpointing what’s hitting the mark (and what’s completely flopping). It provides smart guesses for what kind of content will perform best in the future.
- Scheduling & Optimization: No more guessing the best times to post. AI looking at your past performance and broader LinkedIn trends means AICreatify can suggest the best times and content formats for your specific audience.
- Competitor Insights: Curious what your top competitors are doing to get those numbers? AICreatify can break down how they get people hooked, what content works best for them, and how their audience reacts. This helps you find gaps and opportunities to absolutely beat them.
It’s not just about content. It’s about getting every little part right. Take Instagram Caption Generator or Hashtag Generator, for instance. Even though they’re for other platforms, the principles behind AI-driven optimization – like keyword relevance and compelling language – are universal for social media.
Frequently Asked Questions
What is a good engagement rate on LinkedIn?
Generally, for company pages, you’ll want to aim for 0.5-2%. For individual posts, though, you should shoot for 2-5%. Top-performing content or niche accounts, in my experience, often hit above 6-8%+. It really just depends on your industry and company size, so do check the specific benchmarks we covered earlier!
How do I calculate my LinkedIn engagement rate?
The most effective way, especially for individual posts, is: (Total Engagements / Total Impressions) * 100%. Total Engagements includes reactions, comments, shares, and clicks. This gives you a clear picture of how many people who saw your content actually interacted with it.
Which industries have the highest engagement rates on LinkedIn?
Typically, Technology & SaaS and Professional Services (like Consulting or Marketing Agencies) tend to see the highest engagement rates. This is primarily due to a culture of rapid innovation, a big emphasis on sharing smart ideas, and highly active professional communities hungry for expert insights and updates.
What is the average engagement rate for B2B on LinkedIn?
Across all B2B industries, the average engagement rate typically ranges from 1-3%. However, this is a broad average and can change a lot based on content quality, audience size, and the specific niche within B2B. Always aim for the higher end of this range or higher than your specific industry average if you want to be seen as effective.
Does posting more frequently increase LinkedIn engagement?
Not necessarily. The key here is quality over quantity. While consistent posting (say, 3-5 times a week for company pages) can keep you visible, simply churning out low-value content will actually water down your engagement. The LinkedIn algorithm rewards meaningful interaction and dwell time, not just volume. Focus on publishing valuable, audience-centric content consistently, then test and learn to see what frequency resonates best with your specific audience. Sometimes less, but better, is far more.
You’ve got the data, Maria. You’ve got the strategies. You’ve even got the secret weapon in AI. There’s no more room for guessing or just “throwing spaghetti at the wall” to see what sticks.
It’s time to stop just tracking metrics and start influencing them. Ready to transform your LinkedIn presence from a vanity metric to a genuine revenue driver? Go explore AICreatify’s AI-powered tools. They’re built to help you understand, improve, and absolutely own your industry’s benchmarks.
About Author
Susha Kanaujia
Product Manager and AI enthusiast with 16+ years of experience in technology and digital products.
About AICreatify
AICreatify is a modern B2B AI marketing platform designed to help builders, creators, and teams automate their marketing workflows. From crafting scroll-stopping social copy to launching fully optimized SEO campaigns, we give you the tools to accelerate your growth.
Try AICreatify for free